Master Thesis
Machine learning algorithms can be hard to understand. In simpler models, such as linear regression or a decision tree with few parameters, the interpretation is straightforward. However, models that are not inherently interpretable due to their high complexity can benefit from methods that aim to explain the reasoning behind these models.
Existing Methods
Various methods exist to explain models from different perspectives. Partial Dependence Plots, for example, are a straightforward explanation method that measures how a prediction would change if a feature value were swapped out and replaced with other values. (See my full explanation and quiz here). SHAP is another explanation method that tries to measure how much each feature contributes to the final prediction, which allows the feature influence to be compared.
An extension to SHAP
If a model consists of up to three features, the SHAP values can be visualized in a 3D plot. In this case, instances that are close to one another are similar with respect to the features that influenced their predicted value. Unfortunately, a complex model likely relies on more than three features, which cannot be visualized. However, techniques exist that aim to retain as much information as possible from the higher-dimensional space and project it into a lower-dimensional space that can be visualized. Common techniques include Principal Component Analysis, autoencoders or UMAP. UMAP tends to form clusters, which makes it useful in scenarios where group analysis is important.
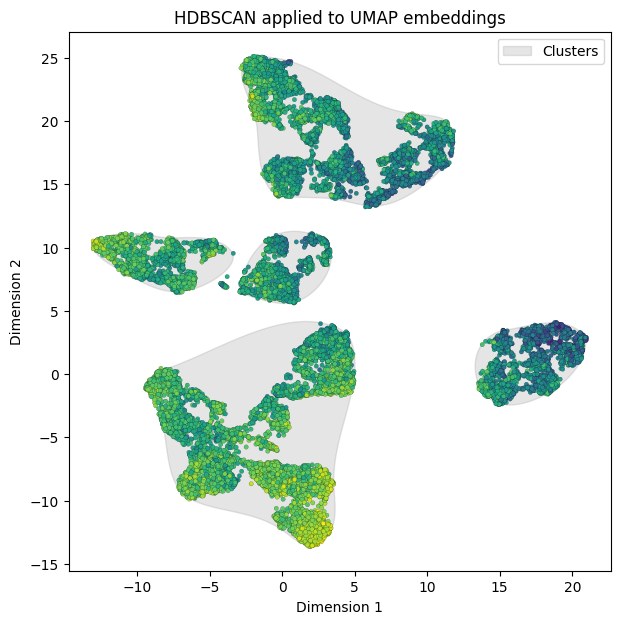
Similar points form clusters. Lighter points correspond to higher predicted values.
The plot above shows clear separation between clusters. Therefore, each of the groups is affected differently by each of the features. The clusters were formed using HDBSCAN, which clusters points based on density and requires fewer hyperparameters than regular DBSCAN, which does not consider point density. Now, the clusters can be examined in terms of the features that influence predictions across the entire sample.
Context Similarity
Some explanation methods can be applied across all models, whether they are neural networks or tree-based methods. Tree-based methods continue to dominate the field of tabular data regression, which is why I used them in my thesis to predict life satisfaction based on a person's characteristics, such as age, gender, or financial situation.I applied two techniques that leverage the nature of tree-based methods, by using features directly in the decision trees rather than relying on obscure layers found in neural networks.
Lift
Features may jointly influence a target. A common example is the influence of features like size and neighborhood on house prices. A large house in the city center may cost significantly more than a large house in a less desirable location or a smaller house in the city center, so there is a joint effect on the target. In some models, this joint effect can be quantified using a metric known as lift. Lift measures how often a feature combination occurs compared to how often it would occur if the pair were statistically independent.I borrowed this concept from data mining, where it is used to find frequent itemsets. For example the lift value of two features "Physical health" and "Number of children" can be written as
A high lift value indicates that two features frequently occur together. Applying the concept to my model led to these results:
Feature 1 | Feature 2 | Lift |
|---|---|---|
When period of financial hardship stopped | Period of financial hardship | 94 |
When financial hardship period started | When financial hardship period stopped | 29 |
Suicidal feelings or wish to be dead | Afford to pay an unexpected expense | 9 |
Current job situation | Country | 8 |
The results intuitively make a lot of sense. Features that are related to financial hardship occur together.
You can find the corresponding page in my survey here.
Word2Vec
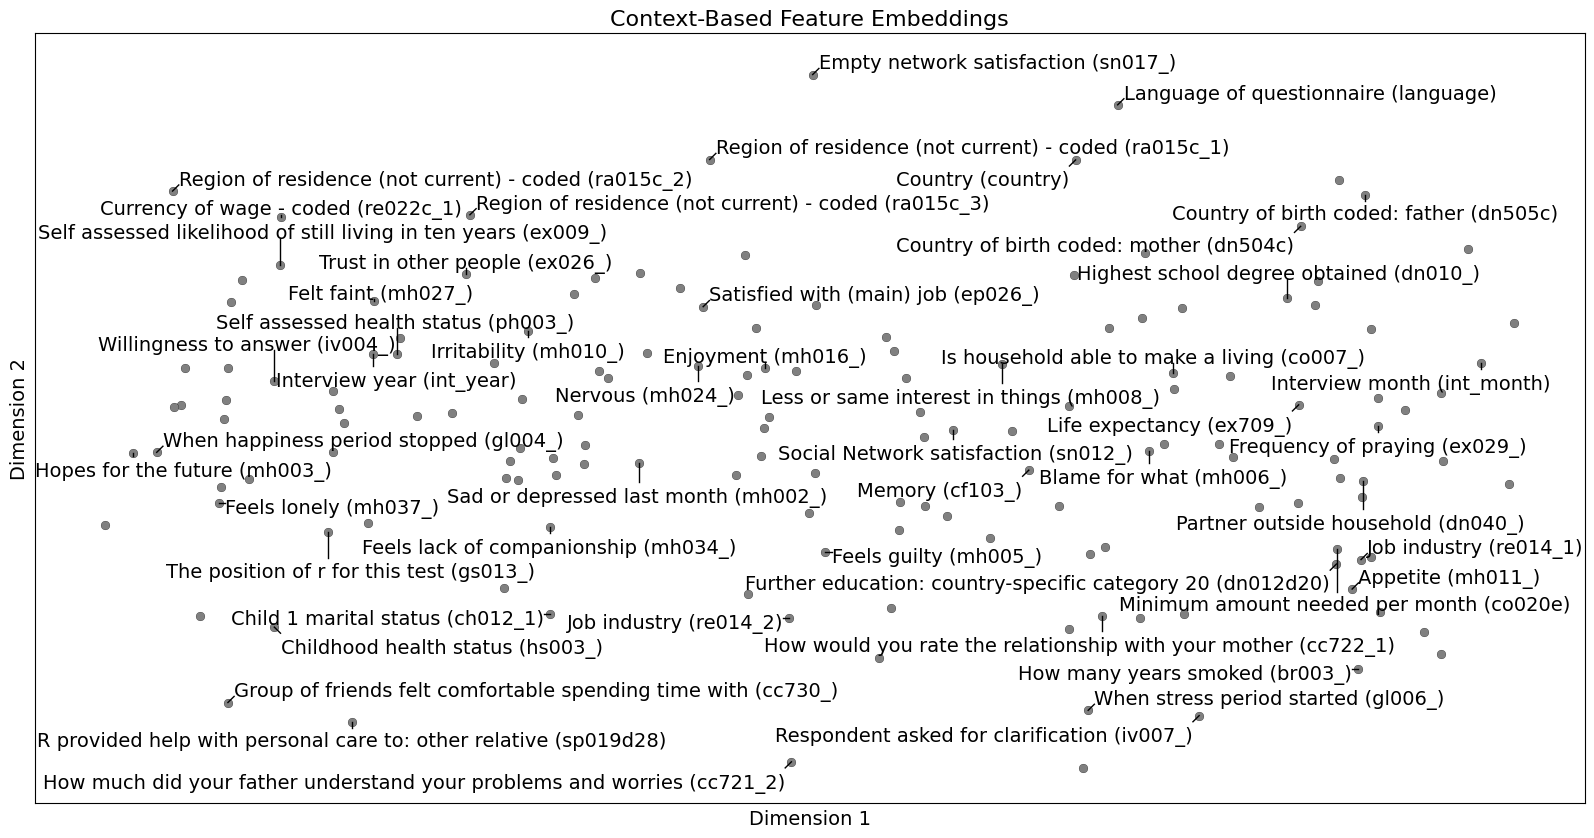
Another method for measuring and visualizing context similarity is Word2Vec. Originally, Word2Vec was used to find word similarity based on their usage in sentences. However, this concept can also be applied to tree-based methods. Word2Vec is a neural network that employs either the CBOW (Continuous Bag of Words) method, which predicts the target word based on surrounding context words, or the Skip-gram method, which predicts the surrounding context words given a target word. The network consists of one hidden layer that corresponds to the latent space, which can be visualized. Features that are close in latent space likely occur in similar contexts.
You can find my survey for Word2Vec here.
My full thesis is also available on the universities website and can be found here
Referenced Links
tobias-wetzel.com
https://tobias-wetzel.com/thesis/survey/partial-dependence-plot
tobias-wetzel.com
https://tobias-wetzel.com/thesis/survey/lift
tobias-wetzel.com
https://tobias-wetzel.com/thesis/survey/cbow
utheses.univie.ac.at