Creating Synthetic Data
Creating Synthetic Image Data
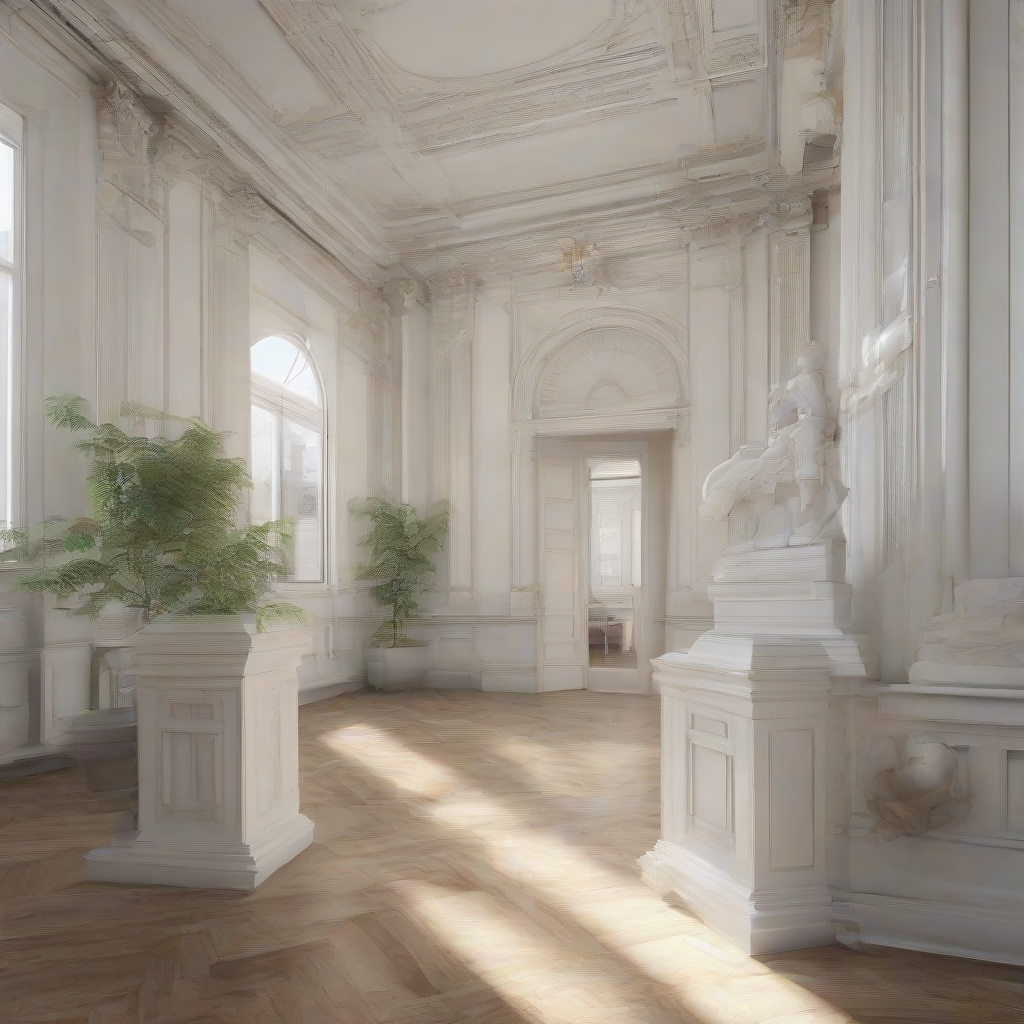
The image depicts a neoclassical building from inside
This is an image that was generated synthetically using this code Stable Diffusion XL. Note that I did not let the image converge to its best resolution. This takes considerably longer and performance of the model this synthetic data was generated for was still great even though the test data consisted of real world data. There are other models that perform reasonably well, such as Stable Diffusion XL Turbo and although the image quality was higher using the Turbo model, the variance was quite low. Most images looked quite similar to one another.
Creating Synthetic Audio Data
In other scenarios you might want to generate Audio Data. While it is possible to also run audio generation models locally, I relied on the TTS API to generate my synthetic data. The process is straightforward. You simply have to provide an audio file for reference and some text and the TTS model will handle the rest for you. This is all the code thats necessary to achieve that:
The audio quality is quite good. I only encountered one issue when trying to generate audio from text that is incorrect, such as "gooood". For my keyword spotting algorithm I wanted to have different emphasis on some characters, to make the model more robust. In this scenario the audio sometimes contained noise.
Creating Synthetic Tabular Data
Generating tabular data is also quite straightforward on your local machine. I used the sdv library to achieve that, which offers several methods to generate data. I did not use a Neural Network to generate the data. While Neural Networks such as variational autoencoders also work great for synthetic data generation, they take much longer to train, especially if you are dealing with high dimensional data.